
























A LIVE LOOK INSIDE A CDMO AI OPERATIONS DASHBOARD

Accelerating
CDMO Visibility with AI

Your data lives in six systems.
Your decisions need one screen.

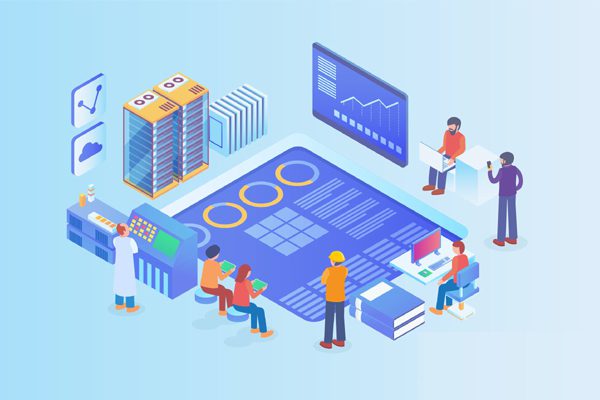
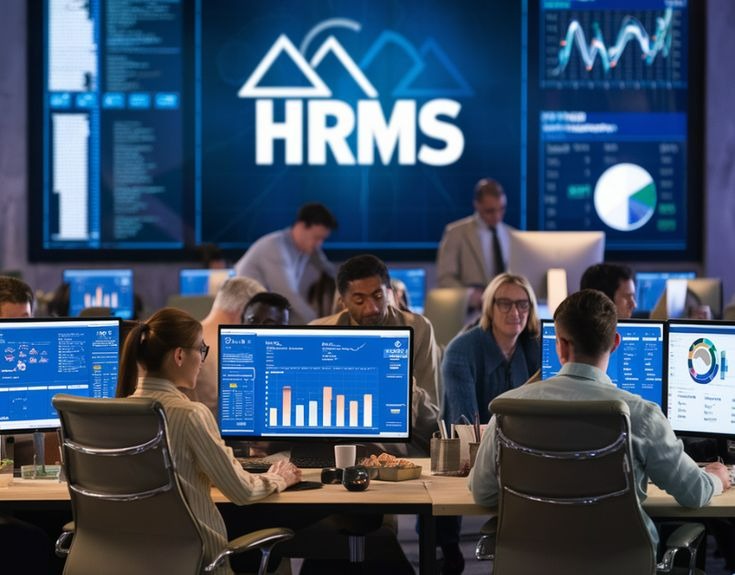
Join a live, 45-minute session and watch a working CDMO operations dashboard use AI to pull manufacturing, lab, supply chain, regulatory, and commercial data into a single view. Live demo, real dashboard architecture, no slideware.

Jul 14 cal icon
MARK YOUR CALENDAR

Tuesday, July 14th

12:00 – 12:45 PM EDT · 45 min
Live on Zoom

FREE TO ATTEND

WHAT YOU'LL SEE LIVE

CORE DASHBOARD VIEWS

Manufacturing & Capacity

Batch success rate, average yield, cycle time, suite utilization, and equipment OEE across API and biologics lines, filtered by client, product, and period.

Quality & Compliance

Right-first-time, open deviations, CAPA on-time closure, and FDA, EMA, MHRA, PMDA audit readiness mapped to the people responsible at each step.

Tech Transfer & Programs

Active programs by phase, next milestone, due date, and health status, tracking transfer cycles that typically run 6 to 18 months in one portfolio view

Finance &
Pipeline

Revenue by client and service line, gross margin, capacity utilization, order backlog, and the sales pipeline funnel pulled from CRM.

WHAT TO EXPECT

1.

See It Run Live

Walk through a working AI dashboard across all four CDMO domains, live.

2.

Map It to Your Stack

See how it connects to your systems and reuses tools you own, including Power BI and QMS.

3.

Take the Next Step

Book a discovery session to define your KPIs and data sources.

The 45 minutes that change how your CDMO runs.

Seats are limited. Reserve yours
before Tuesday, July 14th.

OR SCAN THE QR

hovercode 1
Cart (0 items)

Create your account